Your landing page is where first impressions turn into conversions or drop-offs. But how do you know if it’s actually performing well? The answer lies in tracking the right landing page metrics.
According to HubSpot, businesses that use data-driven landing page optimization see up to a 55% increase in leads compared to those that don’t monitor key metrics.
These numbers highlight just how powerful proper tracking can be. By understanding how visitors interact with your page and optimizing key performance indicators, you can improve user experience, lower bounce rates, and drive more conversions.
What Are Landing Page Metrics and Why They Matter
Landing page metrics are measurable data points that help you evaluate how effectively your landing page performs. These can range from engagement indicators (like bounce rate or time on page) to business outcomes (like conversions or revenue per visitor).
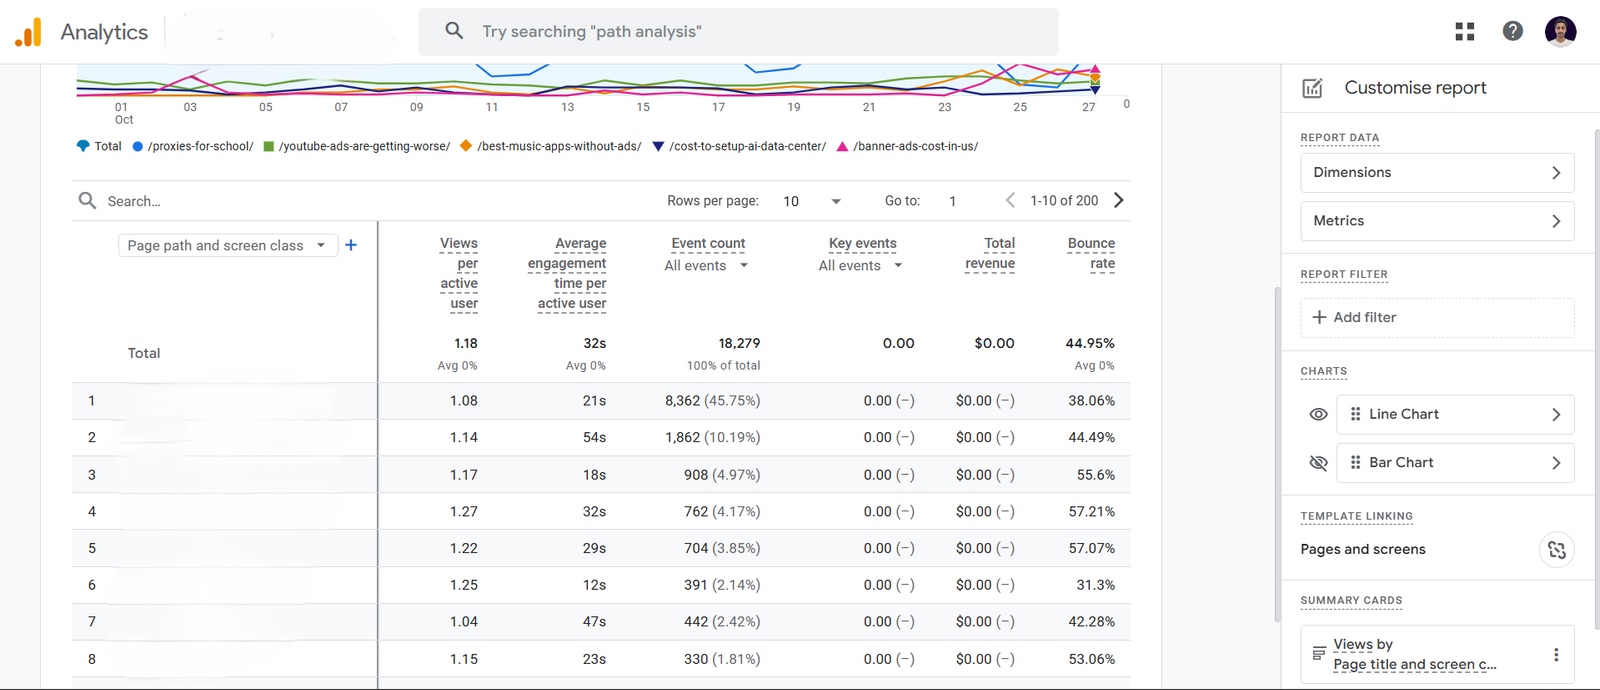
Tracking these metrics gives you a clear picture of user behavior how people arrive on your page, what they do once they’re there, and what prevents them from converting. Without this data, you’re essentially guessing what works and what doesn’t.
The goal isn’t to chase numbers for the sake of it, but to understand the story behind the data. When analyzed correctly, landing page metrics guide your optimization efforts and ensure that every design tweak or content change you make is backed by evidence, not assumptions.
Key Landing Page Metrics You Should Track
| Metric | What It Measures | Why It’s Important | Optimization Tip |
|---|---|---|---|
| Conversion Rate | % of visitors completing desired actions | Indicates overall effectiveness of your landing page | Simplify form fields and strengthen CTA |
| Bounce Rate | % of users leaving without interaction | Reveals engagement quality | Align ad copy and landing page intent |
| Average Session Duration | Time users spend on page | Shows interest and content relevance | Improve readability and content flow |
| CTR | % of clicks on CTAs or links | Measures CTA performance | Use action-driven words and button contrasts |
| Traffic Sources | Channels driving visitors | Helps evaluate campaign ROI | Invest in high-performing channels |
| Form Submission Rate | % of users completing form | Direct indicator of lead conversion | Reduce form friction and add incentives |
| Page Load Time | Seconds to load the page | Affects UX and SEO ranking | Compress media and enable caching |
| Scroll Depth | % of page scrolled by users | Indicates content engagement | Move key CTAs higher if drop-offs occur |
| Exit Rate | % of users leaving from the page | Reveals friction points | Optimize weak content sections |
| ROI / Revenue per Visitor | Revenue contribution per visitor | Connects performance to business outcomes | Track with integrated CRM or analytics tools |
1. Conversion Rate
Your conversion rate is the single most important landing page metric. It measures the percentage of visitors who complete your desired action — whether that’s signing up for a newsletter, downloading an eBook, or making a purchase.
Formula:
Conversion Rate = (Conversions ÷ Total Visitors) × 100
A “good” conversion rate varies by industry, but most well-optimized pages fall between 2% and 5%.
To improve your conversion rate, focus on:
- Clear, compelling CTAs (call-to-actions)
- Simplified forms
- Strong value propositions
- Fast page load speed
- Social proof (testimonials, case studies, or trust badges)
Small, strategic changes like rewriting your CTA button from “Submit” to “Get My Free Quote” can lead to measurable conversion lifts.
2. Bounce Rate
Bounce rate measures the percentage of visitors who land on your page and leave without taking any action or visiting another page. A high bounce rate can signal that your page content isn’t engaging, your offer isn’t clear, or your audience targeting is off.
However, context matters. For a simple one-page lead form, a higher bounce rate may not be alarming if conversions remain steady.
To reduce bounce rate:
- Match your landing page message with ad copy or search intent
- Use clear, benefit-driven headlines
- Optimize for mobile devices
- Make sure your content loads quickly
3. Average Session Duration
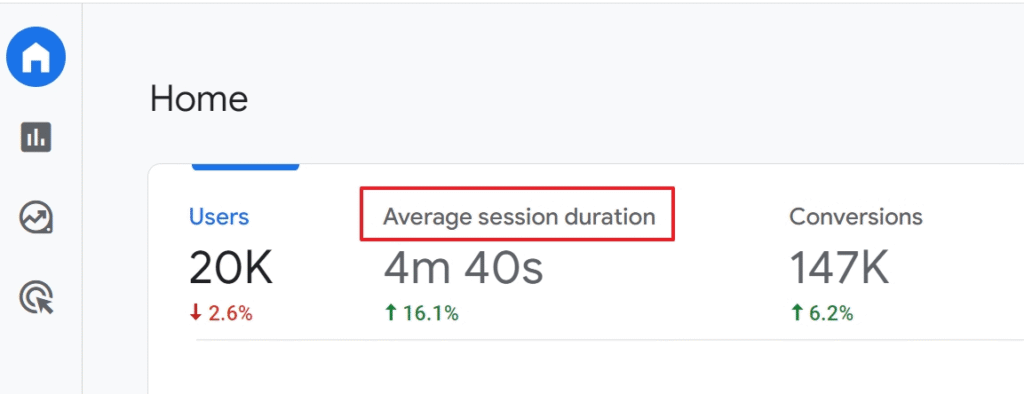
This metric shows how long visitors stay on your landing page. The longer someone spends exploring your content, the more likely they are to convert.
If your average session duration is low, it might mean your content isn’t holding attention or your layout makes it hard to read.
Improve this metric by:
- Adding engaging visuals or short videos
- Structuring content with clear subheadings and white space
- Writing in a conversational, easy-to-follow tone
4. Click-Through Rate (CTR)
CTR measures how often users click on links or buttons compared to how many times they view them. It’s especially useful for pages that drive visitors to another step, such as a checkout page or pricing page.
Low CTR often means your CTAs aren’t compelling or are getting lost in clutter. Test variations of CTA text, button colors, and placement to see what resonates most.
5. Traffic Sources
Knowing where your traffic comes from organic search, paid ads, social media, email campaigns, or referrals helps you understand which channels deliver the highest-quality visitors.
For example, if traffic from Google Ads converts at a much higher rate than organic traffic, you might want to invest more in your paid campaigns or adjust your SEO strategy to target more transactional keywords.
Tracking traffic sources also helps you align messaging. A user coming from a Facebook ad might need different content than someone arriving via a Google search result.
6. Form Submission Rate / Lead Conversion Rate
If your goal is to generate leads, track how many users fill out and submit your form. Even small barriers like too many fields or unclear instructions can lower your submission rate.
To increase lead conversions:
- Keep forms short (ask only what’s necessary)
- Use clear microcopy and progress indicators
- Offer incentives like free trials or downloadable guides
- Ensure form validation works smoothly
7. Page Load Time
In today’s fast-paced world, every second counts. Page load time has a direct impact on both user experience and SEO rankings. Studies show that even a one-second delay in load time can reduce conversions by up to 7%.
Use tools like Google PageSpeed Insights or GTmetrix to identify performance bottlenecks. Compress images, minimize scripts, and use caching to improve load speed.
A fast, responsive landing page doesn’t just keep users happy it also boosts your visibility in search results.
| Page Load Time | Average Conversion Rate |
|---|---|
| 1 second | ~3.05% |
| 2 seconds | ~2.7% |
| 3 seconds | ~2.1% |
| 4+ seconds | Drops below 1.5% |
8. Scroll Depth and Engagement Heatmaps
Scroll depth shows how far visitors scroll down your page, while heatmaps reveal which elements attract the most attention. These visual analytics tools help you understand how users interact with your design.
If most users drop off before reaching your CTA, consider moving it higher on the page. If they hover or click around certain areas, you’ll know what catches their eye.
Tools like Hotjar and Crazy Egg make it easy to track these insights visually, so you can optimize based on real behavior rather than assumptions.
9. Exit Rate
While bounce rate measures single-page visits, exit rate tracks where users leave your site after browsing multiple pages. If a specific landing page has a high exit rate, it may not be fulfilling user expectations.
Compare exit pages to identify patterns. Maybe users consistently leave after viewing your pricing section indicating that your offer isn’t clear or competitive enough.
10. ROI / Revenue per Visitor
At the end of the day, every metric should tie back to revenue. Tracking ROI per visitor tells you how effectively your landing page contributes to your bottom line.
To measure this, connect your analytics platform with your CRM or eCommerce system. Monitor metrics like cost per lead (CPL), average order value (AOV), and lifetime value (LTV).
The goal is to ensure every marketing dollar spent drives measurable business impact.
Advanced Landing Page Analytics to Consider
Once you’ve mastered the basics, you can dig deeper into advanced metrics that uncover hidden insights:
Multi-touch attribution: Understand which marketing channels contribute to conversions at different touchpoints.
Session recordings: Watch anonymized replays to see exactly how users navigate your page.
Conversion path visualization: Identify where users drop off along the funnel.
Device-specific metrics: Compare desktop vs. mobile behavior to optimize responsiveness.
Campaign tracking: Measure landing page performance by campaign, ad group, or keyword.
Advanced analytics allow you to see not just what is happening, but why. This deeper understanding is where true optimization begins.
How to Track These Metrics Effectively
Use the Right Tools
You don’t need an expensive tech stack to start tracking metrics. Tools like Google Analytics 4, Hotjar, HubSpot Analytics, and SEMrush provide all the insights you need to measure performance.
For most marketers, GA4 should be the foundation. It allows you to set conversion goals, create event-based tracking, and analyze user behavior across devices.
Complement GA4 with heatmap tools (like Crazy Egg) and reporting platforms (like Looker Studio) to visualize trends.
| Tool | Primary Use | Best For | Notable Feature |
|---|---|---|---|
| Google Analytics 4 | Comprehensive data tracking | All websites | Event-based tracking and conversion goals |
| Hotjar | Heatmaps and user session recordings | UX insights | Visualize scroll and click behavior |
| HubSpot Analytics | Marketing and lead tracking | B2B and inbound | CRM integration and form tracking |
| Crazy Egg | Heatmaps and A/B testing | CRO optimization | Confetti and overlay visual analytics |
| Looker Studio | Reporting and visualization | Teams and agencies | Custom dashboards and automation |
| GTmetrix | Performance optimization | Speed improvement | Detailed page load waterfall reports |
Set Up Conversion Goals
Tracking metrics is only useful if you’ve defined clear conversion goals. These goals could include:
- Completing a form
- Clicking a “Buy Now” button
- Signing up for a newsletter
- Downloading a whitepaper
In GA4, you can create custom events to track these actions. Make sure to name them clearly and verify that they’re firing correctly.
Common mistakes include forgetting to test goals, using incorrect URLs, or not setting proper thank-you pages. Regular audits help you avoid data discrepancies.
Automate Reporting
Manually checking numbers can be time-consuming. Instead, build automated dashboards using Google Looker Studio or HubSpot Reports.
Set up weekly or monthly reports that highlight key metrics like conversion rate, bounce rate, and revenue per visitor. Visualization helps you quickly identify what’s improving and what needs attention.
Automated reporting also ensures your team stays aligned and data-driven in every decision.
Interpreting Landing Page Data for Optimization
Metrics alone don’t create results it’s how you interpret and act on them that matters.
Start by identifying your top-performing landing pages and analyzing what makes them successful. Is it the design, headline, or offer? Then look at underperforming pages to find patterns. Maybe they lack a strong CTA or load slowly on mobile.
Use A/B testing tools to validate your hypotheses. Change one element at a time like button text or image placement and compare results.
A metric-driven optimization cycle might look like this:
- Track → 2. Analyze → 3. Test → 4. Improve → 5. Repeat
Over time, this process helps you refine your landing pages until they deliver maximum conversions.
| Observation | Possible Cause | Action Step |
|---|---|---|
| High bounce rate | Irrelevant offer or slow loading | Align messaging, improve page speed |
| Low CTR | Weak CTA or poor visual hierarchy | Rewrite CTA and test placement |
| Short session duration | Unclear content or layout | Improve readability and internal linking |
| Low form submission rate | Too many fields or trust issues | Simplify form, add testimonials |
| High exit rate | Poor next-step clarity | Add clear navigation or exit-intent popups |
Common Mistakes Marketers Make When Tracking Landing Page Metrics
Even experienced marketers fall into a few common traps when analyzing landing page data:
Focusing on vanity metrics – Metrics like total page views or likes look good on paper but don’t always reflect real performance.
Ignoring segmentation – Average metrics can hide insights. Segment data by traffic source, device type, or audience.
Not aligning metrics with funnel stages – Early-stage pages may aim for engagement, not conversions. Track accordingly.
Misconfigured analytics – Missing tags or broken scripts lead to inaccurate reporting.
Avoiding these pitfalls ensures you’re making decisions based on reliable, actionable data.
Expert Tips to Boost Landing Page Performance
Audit regularly: Review your analytics setup every quarter to ensure accuracy.
Combine quantitative and qualitative data: Numbers tell what’s happening; user feedback explains why.
Run A/B tests consistently: Continuous testing prevents stagnation.
Use AI analytics: Tools like Pendo or Smartlook can detect patterns and predict user behavior.
Focus on user intent: Every landing page should meet the visitor’s expectations from the moment they arrive.
Landing Page Optimization Readiness Checklist
| Area | Check | Status |
|---|---|---|
| Analytics setup tested | ✅ | |
| Conversion goals configured | ✅ | |
| Page load speed under 3 seconds | ✅ | |
| CTAs A/B tested | ✅ | |
| Heatmaps reviewed monthly | ✅ | |
| Form fields minimized | ✅ | |
| Content matches ad copy intent | ✅ |
Key Takeaways
Track what matters most: Focus on core KPIs like conversion rate, bounce rate, CTR, and ROI instead of vanity metrics.
Speed is crucial: Every second counts a one-second delay in page load time can reduce conversions by up to 7%.
Know your traffic sources: Identify which channels (organic, paid, social, or email) bring the highest-quality leads.
Use visual analytics: Heatmaps and scroll-depth tools like Hotjar and Crazy Egg reveal how users interact with your content.
Set clear conversion goals: Use Google Analytics 4 or similar tools to define, track, and measure key actions.
Analyze and act: Metrics only matter when they drive decisions use A/B testing to validate improvements.
Align metrics with funnel stages: Awareness = traffic and engagement; Consideration = CTR and duration; Decision = conversions and ROI.
Combine data with feedback: Quantitative insights + user feedback = more meaningful optimization.
Review regularly: Audit your landing page analytics setup quarterly to ensure data accuracy.
Optimization never ends: Continually test CTAs, messaging, and layout to maintain performance over time.
FAQ’S
1. How to track a landing page
You can track a landing page by integrating analytics tools like Google Analytics 4, Hotjar, or Microsoft Clarity. Set up event tracking and goals to measure conversions, bounce rate, session duration, and user interactions such as form submissions or button clicks. These insights reveal how visitors engage and where improvements are needed.
2. What kind of metrics should I be tracking
Track metrics that show engagement and conversion performance, including conversion rate, bounce rate, average time on page, traffic sources, and click-through rate (CTR). For deeper insight, monitor scroll depth and form completion rate to understand user intent and experience quality.
3. How to measure landing page success
Landing page success is measured by how well it converts visitors into leads or customers. The key metric is the conversion rate, supported by engagement metrics like CTR, bounce rate, and average session duration. A successful landing page has a clear call-to-action, fast load speed, and low abandonment rate.
4. What is the difference between metrics and KPIs
Metrics track general performance data (like bounce rate or session time), while Key Performance Indicators (KPIs) measure progress toward specific goals, such as achieving a 10% conversion rate. Every KPI is a metric, but not all metrics are KPIs – KPIs are tied to business outcomes.
5. What are good website metrics
Good website metrics include traffic sources, conversion rate, pages per session, bounce rate, and average session duration. Together, these metrics help evaluate user engagement, site usability, and marketing effectiveness.
6. How to measure effectiveness of a website
To measure website effectiveness, track KPIs such as lead conversions, goal completions, organic traffic growth, and page load speed. Combine quantitative data from tools like Google Analytics with qualitative insights from user feedback or heatmaps for a complete performance view.
Is 3% a good conversion rate
Yes a 3% conversion rate is generally considered average to good across most industries. However, performance varies by niche; high-performing landing pages in competitive markets can reach 10% or higher when optimized for audience targeting, design, and clarity.